Brazil ANVISA Registration Trends and Market Access Data (2024-2025)
Original analysis of 111,000+ ANVISA medical device registrations, showing Brazil market trends, leading registration holders, category shifts, and market entry strategy.
Executive Summary
Brazil's medical device market is experiencing unprecedented growth. Our original analysis of the complete ANVISA medical device registration database — covering 111,789 records, 96,881 unique registrations, 4,118 registration holders, and 12,412 manufacturers across 88 countries — reveals a market that is not only expanding in volume but fundamentally reshaping in structure.
In 2025, ANVISA processed 10,639 new registration records, the highest annual total in the agency's history and a 16.2% year-over-year increase from 2024. The number of active registration holders reached 1,578, a figure that has nearly tripled since 2010. China has surpassed the United States as the leading country of origin for medical devices registered in Brazil, and an entirely new class of market entrants is redefining how foreign manufacturers access this $10+ billion market.
This article presents the first publicly available, data-driven analysis of the Brazilian medical device regulatory landscape at this depth. Every chart, table, and statistic in this article is derived from our direct analysis of ANVISA's official registration database.
1. The Brazilian Medical Device Market: Why It Matters
Brazil is the largest medical device market in Latin America and the fourth-largest in the Americas. Key indicators:
- Population: 215+ million, with ~75% relying exclusively on the public SUS system
- Healthcare expenditure: $135 billion (~9.7% of GDP)
- Medical device imports: $9.33 billion in 2024 (18% YoY growth)
- 4-year import growth: 54% cumulative increase from $6.07B in 2021
- Projected domestic market: $7.3B by 2028 at 5.1% CAGR
- Import dependency: ~50% of medical devices consumed in Brazil are imported
For medical device manufacturers looking to expand internationally, Brazil represents a market that is too large to ignore — but also too complex to enter without a deliberate strategy. ANVISA's regulatory requirements, the mandatory Brazilian Registration Holder (BRH) structure, GMP certification via B-GMP or MDSAP, and Portuguese-language documentation requirements create a significant barrier to entry that rewards careful planning and the right local partner.
2. ANVISA Registration Volume: A Decade of Growth
Our analysis of the ANVISA database reveals a clear secular growth trend in medical device registrations. The data tells a story of a market that has grown substantially from approximately 4,000 annual registrations in 2014 to over 10,000 in 2025.
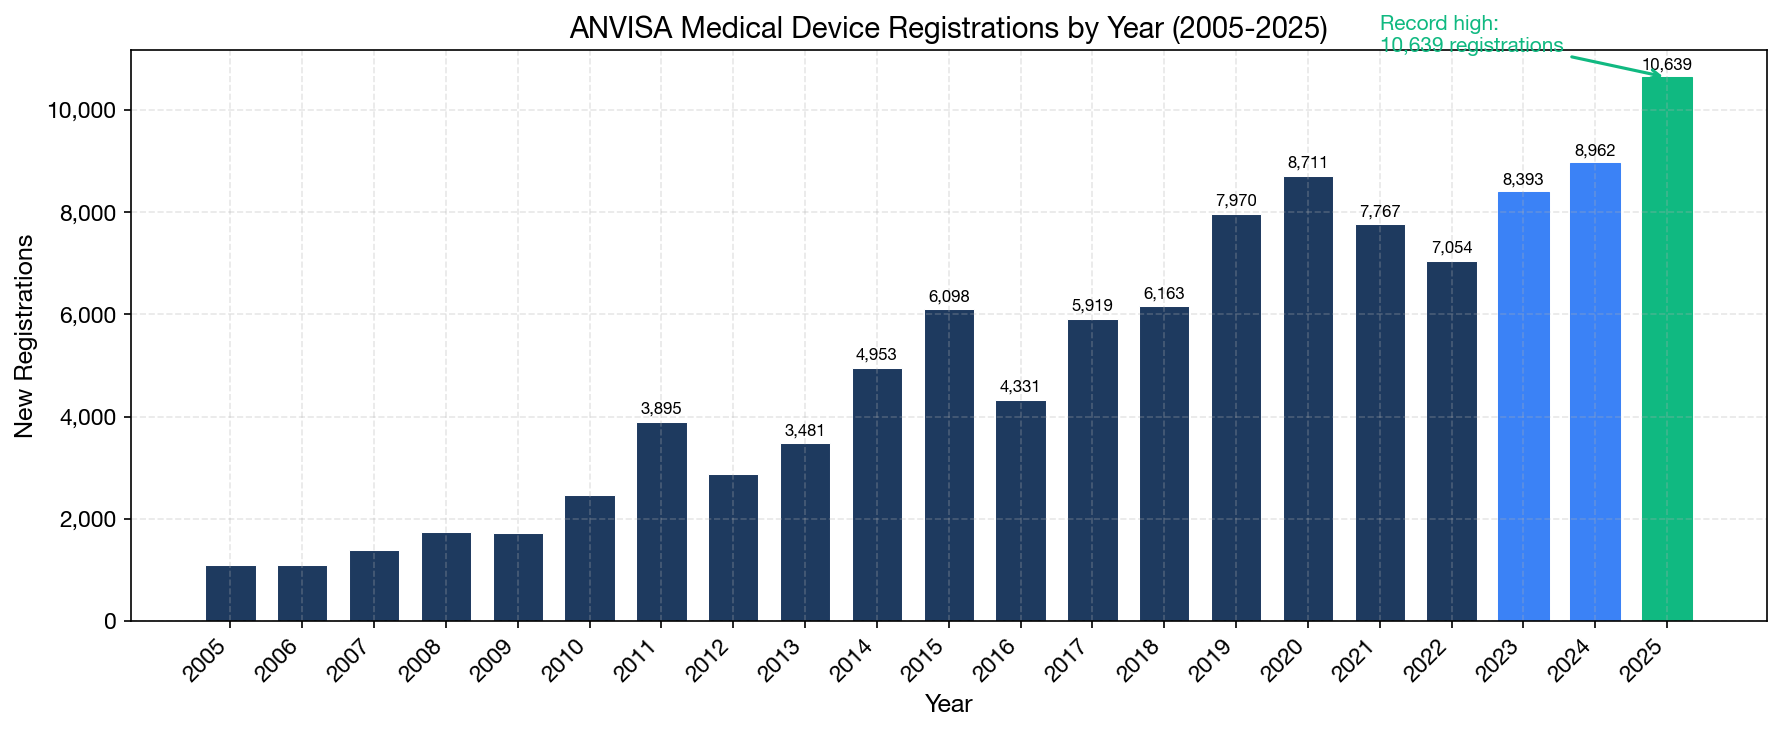
Key Volume Metrics (2020–2025)
| Year | Total Records | Unique Registrations | Active Holders | YoY Growth |
|---|---|---|---|---|
| 2020 | 8,711 | 7,490 | 1,280 | +5.7% |
| 2021 | 7,767 | 6,644 | 1,301 | -11.3% |
| 2022 | 7,054 | 6,237 | 1,238 | -6.1% |
| 2023 | 8,393 | 7,362 | 1,282 | +18.0% |
| 2024 | 8,962 | 7,921 | 1,446 | +7.6% |
| 2025 | 10,639 | 9,207 | 1,578 | +16.2% |
The 2020 surge was driven by COVID-related PPE and diagnostic registrations (the "CORONAVÍRUS" product category alone accounts for 933 registrations). Post-pandemic normalization in 2021–2022 was followed by strong recovery, with 2025 setting an all-time record. Two structural drivers explain this sustained growth:
- Regulatory modernization: ANVISA has actively reduced its registration backlog, expanded staffing, streamlined submission processes, and begun deploying its own AI system ("AnvisAI") to accelerate reviews.
- Market entry by new players: 636 new registration holders entered the Brazilian market for the first time in 2024-2025, bringing fresh product portfolios and competitive energy.
Quarterly Registration Trends
Breaking the data into quarterly intervals reveals more granular patterns that annual totals obscure:
| Quarter | Records | Unique Regs | Active Holders | Class I | Class II | Class III | Class IV |
|---|---|---|---|---|---|---|---|
| 2023-Q1 | 1,914 | 1,635 | 548 | 486 | 847 | 342 | 239 |
| 2023-Q2 | 2,032 | 1,791 | 580 | 527 | 976 | 396 | 133 |
| 2023-Q3 | 2,220 | 1,979 | 620 | 660 | 1,034 | 312 | 214 |
| 2023-Q4 | 2,227 | 1,957 | 634 | 703 | 957 | 373 | 194 |
| 2024-Q1 | 2,085 | 1,870 | 632 | 582 | 1,048 | 275 | 180 |
| 2024-Q2 | 1,943 | 1,752 | 605 | 641 | 865 | 284 | 153 |
| 2024-Q3 | 2,566 | 2,278 | 755 | 736 | 1,175 | 455 | 200 |
| 2024-Q4 | 2,368 | 2,021 | 678 | 645 | 917 | 551 | 255 |
| 2025-Q1 | 2,586 | 2,279 | 706 | 683 | 1,204 | 526 | 173 |
| 2025-Q2 | 2,623 | 2,251 | 713 | 699 | 1,090 | 574 | 260 |
| 2025-Q3 | 2,951 | 2,558 | 784 | 737 | 1,333 | 556 | 325 |
| 2025-Q4 | 2,479 | 2,119 | 752 | 586 | 1,096 | 548 | 249 |
| 2026-Q1 | 2,264 | 2,017 | 642 | 704 | 1,001 | 343 | 216 |
Q3 2025 was the strongest single quarter in ANVISA history: 2,951 records and 2,558 unique registrations, with 784 active holders — all record highs. The Q3 strength is consistent across both 2024 and 2025, suggesting a structural pattern where the third quarter consistently sees peak registration activity. Manufacturers planning their submission timelines should be aware that Q3 may see longer queue times.
The quarterly data also reveals a notable shift in risk class composition. Class III registrations jumped from an average of ~330/quarter in 2023 to ~550/quarter in Q3-Q4 2024 and Q1-Q2 2025 — a 67% increase — reflecting growing demand for more complex device registrations.
Monthly Seasonality Patterns
Our monthly breakdown reveals consistent seasonality in ANVISA registration activity. The strongest months are typically March, June, September, and December — coinciding with quarterly planning cycles and ANVISA's own internal review deadlines. Manufacturers planning submissions should account for this pattern, as peak months may see longer review queues.
3. Risk Class Distribution: Where the Growth Is
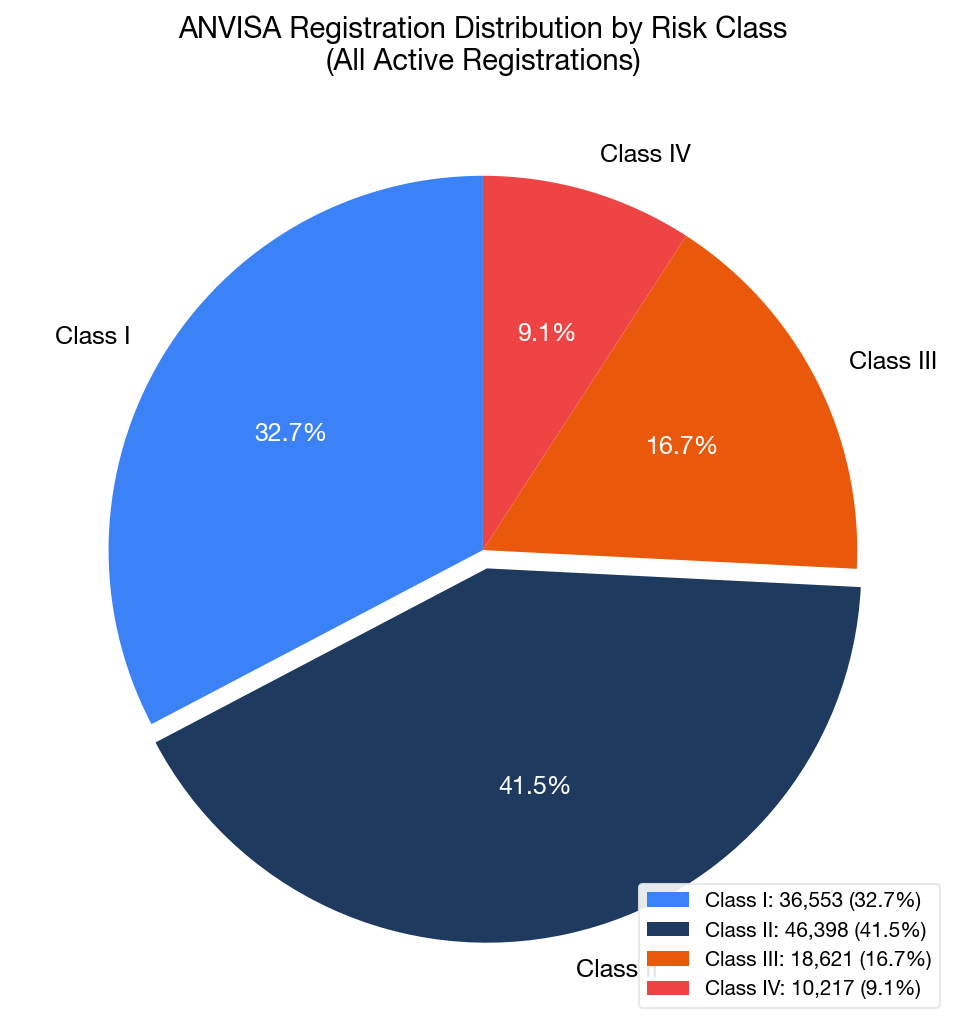
ANVISA classifies medical devices into four risk classes (I through IV), mirroring the complexity and risk profile of each device. Our analysis reveals the current distribution across all 111,789 records:
Overall Distribution
| Risk Class | Records | Share | Description |
|---|---|---|---|
| Class I | 36,553 | 32.7% | Low risk (e.g., bandages, manual surgical instruments) |
| Class II | 46,398 | 41.5% | Medium risk (e.g., catheters, endoscopes, dental devices) |
| Class III | 18,621 | 16.7% | High risk (e.g., orthopedic implants, IVDs) |
| Class IV | 10,217 | 9.1% | Highest risk (e.g., cardiovascular implants, pacemakers) |
Class II devices dominate the market at 41.5%, reflecting the broad range of medical devices in this risk category — from powered surgical instruments and endoscopy equipment to dental products and diagnostic instruments.
Risk Class Trends Over Time (2015–2025)
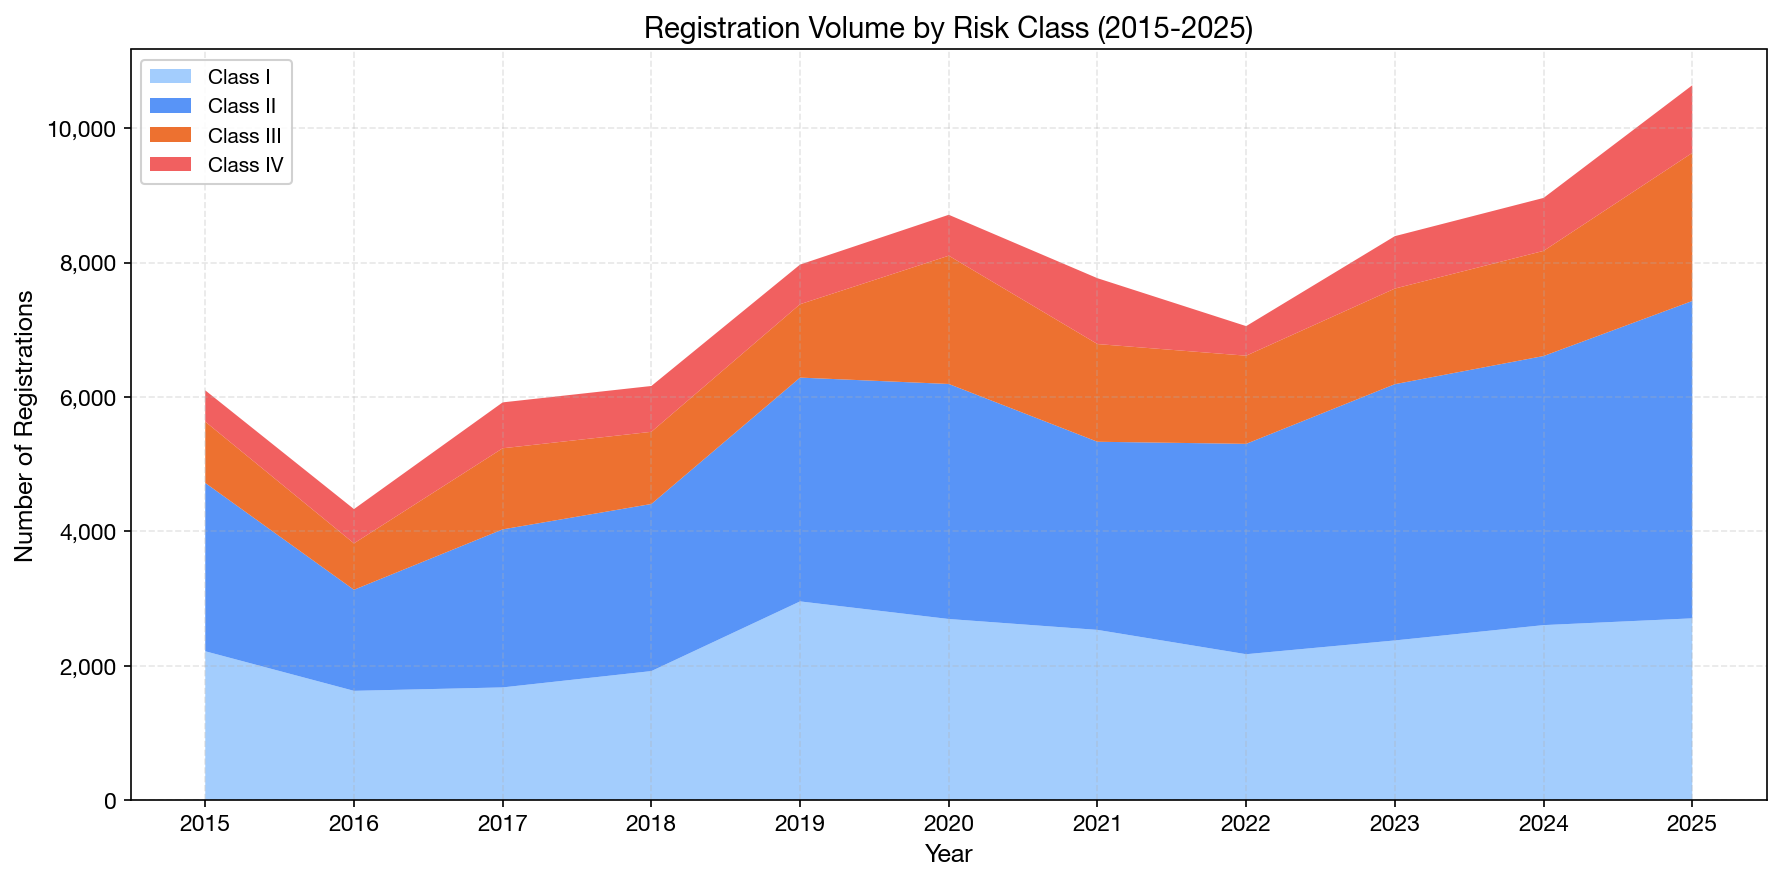
The stacked area chart reveals that while Class I and II devices continue to dominate in absolute numbers, Class III registrations have been growing fastest in recent years:
| Risk Class | 2020 | 2025 | Growth |
|---|---|---|---|
| Class I | 2,695 | 2,705 | +0.4% |
| Class II | 3,498 | 4,723 | +35.0% |
| Class III | 1,909 | 2,204 | +15.5% |
| Class IV | 609 | 1,007 | +65.4% |
The accelerated growth in Class III and IV registrations is significant. These higher-risk devices require more extensive regulatory review, clinical evidence, and post-market surveillance — creating higher barriers to entry but also higher commercial value. For registration holders and regulatory consultants, this shift implies a growing demand for expertise in complex submissions.
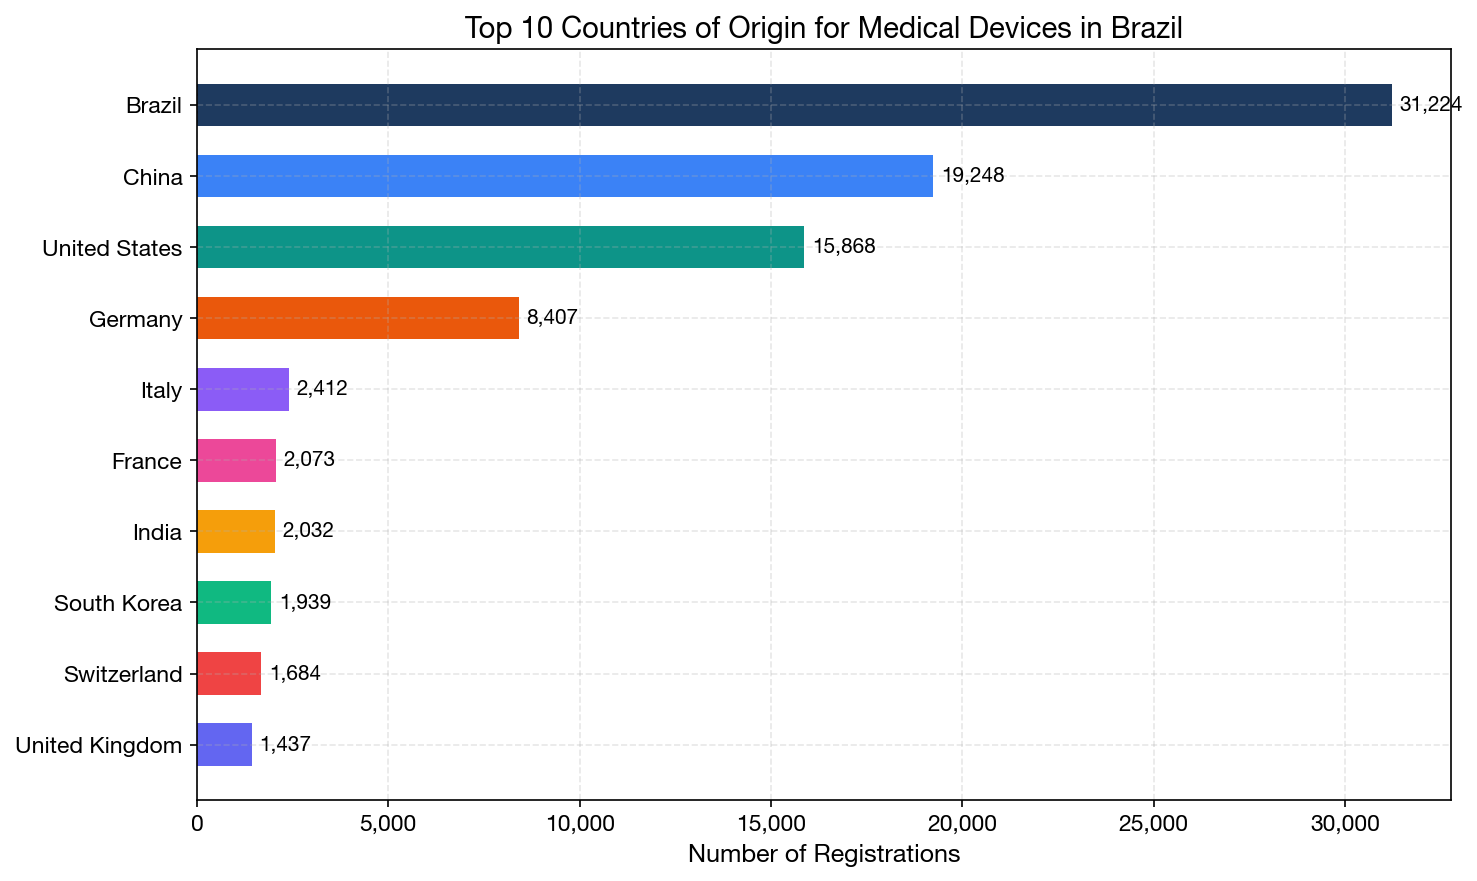
4. Country of Origin: The Shift Toward Asia
Perhaps the most striking finding in our analysis is the dramatic shift in the geographic origin of medical devices registered in Brazil. China has now firmly established itself as the #2 source of medical device registrations, surpassing the United States in annual volume since 2020.
All-Time Top 10 Countries of Origin
| Rank | Country | Records | Unique Regs | Unique Mfgs |
|---|---|---|---|---|
| 1 | Brazil | 31,224 | 31,170 | 2,169 |
| 2 | China | 19,248 | 19,122 | 3,152 |
| 3 | United States | 15,868 | 15,248 | 2,079 |
| 4 | Germany | 8,407 | 8,364 | 837 |
| 5 | Italy | 2,412 | 2,410 | 391 |
| 6 | France | 2,073 | 2,070 | 325 |
| 7 | India | 2,032 | 2,009 | 281 |
| 8 | South Korea | 1,939 | 1,939 | 459 |
| 9 | Switzerland | 1,684 | 1,657 | 221 |
| 10 | United Kingdom | 1,437 | 1,430 | 209 |
Note that China's manufacturer diversity is significantly higher than any other country: 3,152 unique manufacturers versus 2,079 from the US and 2,169 from Brazil. This indicates a highly fragmented Chinese medical device manufacturing landscape, with many small-to-medium manufacturers each producing specialized product lines.
The China-US Divergence
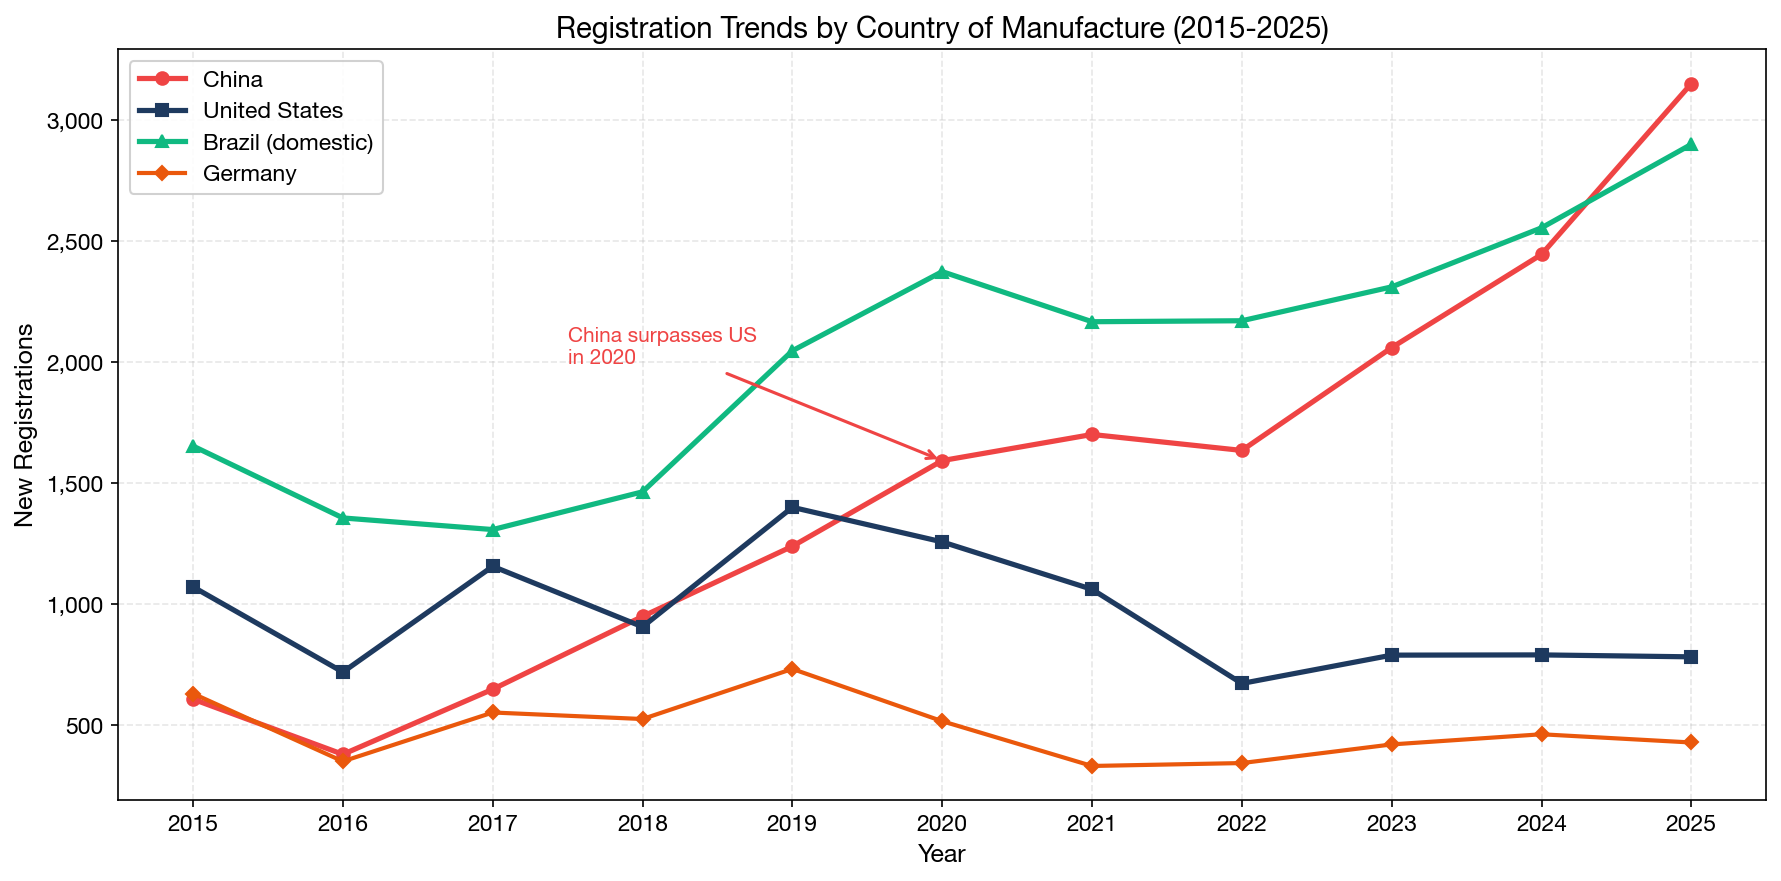
The trend lines reveal a clear structural shift:
| Year | China | USA | Germany | Brazil (domestic) |
|---|---|---|---|---|
| 2015 | 699 | 1,283 | 469 | 2,215 |
| 2018 | 840 | 1,016 | 405 | 1,920 |
| 2020 | 1,593 | 1,257 | 516 | 2,374 |
| 2022 | 1,635 | 671 | 343 | 2,171 |
| 2023 | 2,060 | 784 | 420 | 2,311 |
| 2024 | 2,445 | 787 | 462 | 2,555 |
| 2025 | 3,151 | 773 | 428 | 2,900 |
In 2025, China-origin registrations (3,151) exceeded US-origin registrations (773) by a factor of more than 4:1. This is not merely a COVID-era anomaly — it reflects fundamental manufacturing economics and the rise of Chinese medical device companies seeking international markets. Meanwhile, US-origin registrations have plateaued around 700–800 per year since 2022, down significantly from their 2008 peak of approximately 1,250.
India is another country showing consistent growth — from 162 registrations in 2020 to 290 in 2025, a 79% increase over five years. India, South Korea, and Turkey are the emerging origin countries to watch.
5. Who Holds the Registrations: The BRH Landscape
In Brazil, foreign medical device manufacturers cannot register products directly with ANVISA. They must work through a Brazilian Registration Holder (BRH) — also known as a Detentor de Registro — which is a locally established entity that holds the registration on behalf of the manufacturer. This BRH requirement creates a unique market structure where a relatively small number of specialized companies serve as gatekeepers for international market access.
Our database contains 4,118 unique registration holders. However, the market is highly concentrated: the top 50 holders control a disproportionate share of all registrations.
Top 15 Registration Holders (All Time)
| Rank | Registration Holder | Unique Regs | Unique Mfgs | Countries | Active Since |
|---|---|---|---|---|---|
| 1 | VR Medical | 2,377 | 389 | 31 | 2005 |
| 2 | Siemens Healthcare Diagnósticos | 1,378 | 73 | 17 | 1997 |
| 3 | Roche Diagnóstica Brasil | 1,024 | 48 | 11 | 2003 |
| 4 | Auto Suture do Brasil (Medtronic) | 972 | 103 | 19 | 1998 |
| 5 | Abbott Laboratórios | 882 | 55 | 11 | 1996 |
| 6 | Passrod Importação | 711 | 134 | 28 | 2018 |
| 7 | Emergo Brazil Import (UL) | 666 | 253 | 34 | 2010 |
| 8 | Stryker do Brasil | 641 | 60 | 11 | 2000 |
| 9 | Cirúrgica Fernandes | 640 | 189 | 28 | 1994 |
| 10 | Vyttra Diagnósticos | 635 | 46 | 12 | 2018 |
| 11 | ArgosLab | 620 | 81 | 11 | 2010 |
| 12 | Johnson & Johnson Brasil | 581 | 95 | 16 | 1994 |
| 13 | Laboratórios B. Braun | 517 | 59 | 16 | 1994 |
| 14 | QR Consulting | 511 | 38 | 10 | 2016 |
| 15 | Beckman Coulter do Brasil | 489 | 31 | 16 | 1995 |
This table reveals two distinct types of BRH:
Brand subsidiaries (Siemens, Roche, Abbott, J&J, Stryker, B. Braun): These are the Brazilian subsidiaries of global OEMs, holding registrations primarily for their own parent company's products. They tend to have a high registration count but relatively few unique manufacturers.
Independent AR/BRH service providers (VR Medical, Passrod, Emergo, Cirúrgica Fernandes, QR Consulting): These companies serve as authorized representatives for many external manufacturers. They are characterized by high manufacturer diversity — VR Medical, for example, represents 389 different manufacturers from 31 countries.
Understanding the difference matters for market entry strategy. A manufacturer entering Brazil must choose between establishing its own local subsidiary (expensive and time-consuming) or partnering with an independent BRH. The vast majority of companies — especially small and mid-size manufacturers — choose a BRH partner.
The Growing BRH Market
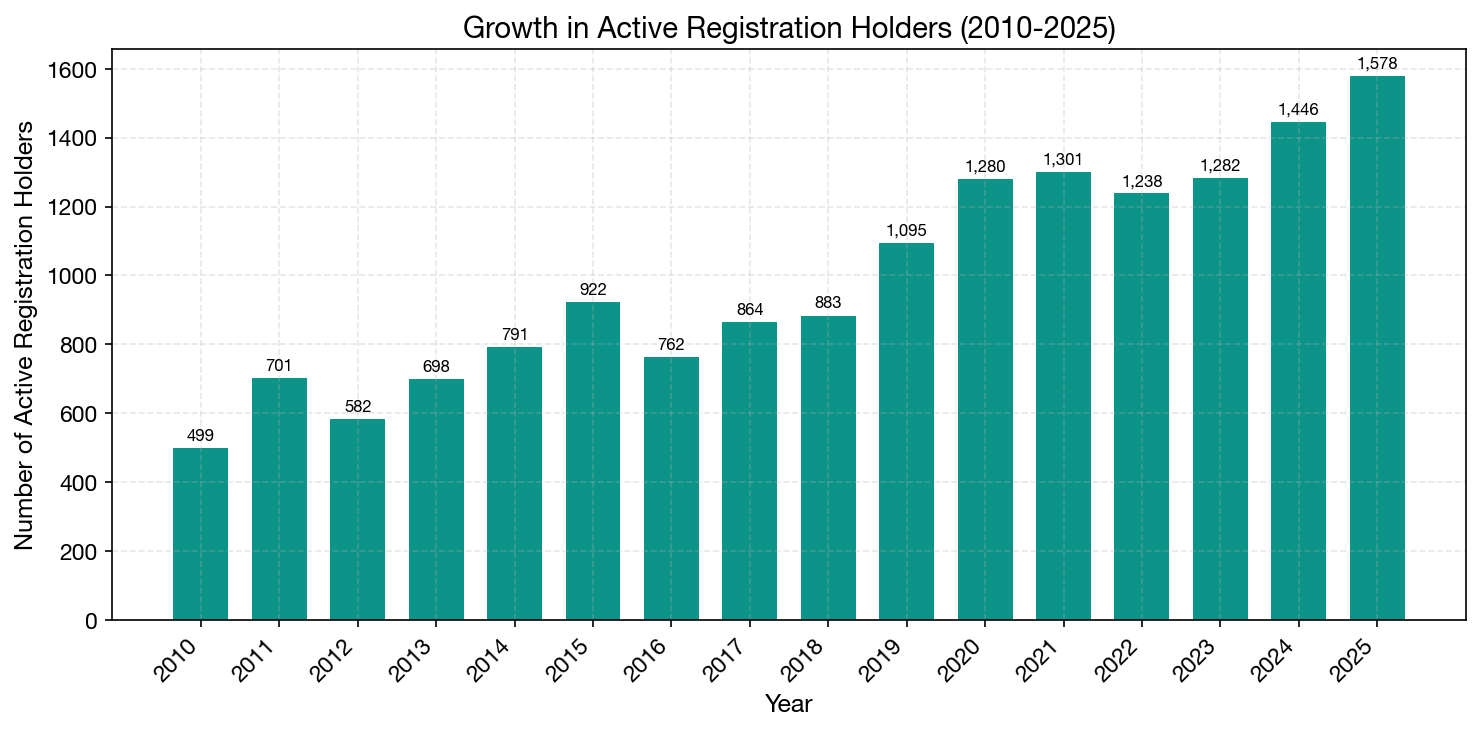
The number of active registration holders has grown dramatically, from 499 in 2010 to 1,578 in 2025 — a 216% increase in 15 years. This growth reflects both the expansion of the Brazilian market and the emergence of new BRH service providers catering to the growing demand from international manufacturers.
Market Concentration Analysis
A key question for any manufacturer entering Brazil is: how concentrated is the BRH market? Our data reveals a moderately fragmented landscape:
| Top N Holders | Registrations | % of All Regs | Interpretation |
|---|---|---|---|
| Top 1 | 2,377 | 2.5% | No single dominant player |
| Top 5 | 6,633 | 6.8% | Low concentration at the top |
| Top 10 | 9,926 | 10.2% | Top 10 hold ~1/10 of market |
| Top 20 | 14,725 | 15.2% | Moderate |
| Top 50 | 23,470 | 24.2% | ~1/4 of market |
| Top 100 | 32,592 | 33.6% | ~1/3 of market |
| Top 200 | 44,659 | 46.1% | Nearly half |
| Top 500 | 63,783 | 65.8% | ~2/3 of market |
The remaining 3,618 holders (88% of all holders by count) collectively hold only 34.2% of registrations. This "long tail" consists primarily of small local manufacturers with fewer than 10 registrations each.
Recent period concentration (2024-2025) shows a similar pattern — the top 10 holders account for 12.4% of recent registrations, and the top 100 hold 37.3%. The market is actually becoming less concentrated over time as new entrants bring in additional registrations, expanding the overall pie.
For manufacturers: This fragmentation is a double-edged sword. On one hand, there are many BRH options to choose from. On the other hand, choosing the wrong partner from the long tail — a company with only a handful of registrations and limited ANVISA experience — carries real execution risk. The data strongly suggests focusing on holders with 50+ registrations and a track record spanning multiple years.
Manufacturer-BRH Relationship Dynamics
Our data reveals fascinating dynamics in how manufacturers choose and sometimes switch between BRH partners:
- 79.3% of manufacturers (9,836 out of 12,407) use only a single BRH — meaning once a manufacturer picks a partner, they tend to stay
- 12.9% (1,606) use exactly 2 BRHs — often indicating a portfolio split between device types or a partial migration
- 7.8% (965) use 3 or more BRHs — typically large multinational manufacturers with diverse product lines distributed across multiple importers
The manufacturers using the most BRH partners are primarily Chinese and Egyptian disposable device makers — companies like Evereast Medical Products Group (24 BRHs), Hubei Best Import & Export (22 BRHs), and Jiangsu Jianerkang Medical (18 BRHs). These manufacturers deliberately distribute their product lines across many local importers/distributors, each of whom acts as BRH for a subset of products.
This data has practical implications: manufacturer loyalty to BRH partners is high. A BRH that wins a manufacturer's first few registrations is likely to retain that relationship for the long term. This makes the initial onboarding experience — speed, cost transparency, and communication quality — critically important.
5.5. Top Manufacturers in the Brazilian Market (2024-2025)
Understanding which manufacturers are most actively registering products in Brazil reveals where market momentum lies.
Top 15 Manufacturers by Registration Volume (2024-2025)
| Rank | Manufacturer | Country | Regs | BRHs Used | Product Categories |
|---|---|---|---|---|---|
| 1 | Marden Medical | Brazil | 193 | 1 | 25 |
| 2 | Shenzhen Mindray Bio-Medical | China | 159 | 5 | 102 |
| 3 | Shenzhen New Industries Biomedical | China | 136 | 2 | 83 |
| 4 | Khayros Diagnóstica | Brazil | 116 | 1 | 74 |
| 5 | Autobio Diagnostics | China | 87 | 1 | 65 |
| 6 | Katal Biotecnológica | Brazil | 86 | 1 | 53 |
| 7 | Renova Medical | Brazil | 85 | 1 | 17 |
| 8 | Hangzhou Alltest Biotech | China | 84 | 9 | 43 |
| 9 | E-Med Produtos | Brazil | 82 | 1 | 38 |
| 10 | Maccura Biotechnology | China | 74 | 2 | 43 |
| 11 | Zhejiang Orient Gene Biotech | China | 72 | 5 | 57 |
| 12 | Medline Industries | USA | 69 | 2 | 21 |
| 13 | Dirui Industrial | China | 64 | 3 | 50 |
| 14 | Labtest Diagnóstica | Brazil | 63 | 1 | 52 |
| 15 | S S White Artigos Dentários | Brazil | 61 | 1 | 30 |
China dominates the top manufacturer list: 8 of the top 15 manufacturers by recent registration volume are Chinese companies, and these are primarily IVD/diagnostic companies (Autobio, Alltest, Maccura, Orient Gene, Dirui) or multi-segment medical device conglomerates (Mindray, New Industries).
Mindray's approach is particularly instructive. With 159 registrations spread across 5 different BRH partners and 102 product categories, Mindray uses a multi-BRH strategy to maximize market coverage. This is typical of large Chinese manufacturers that are building comprehensive portfolios in Brazil.
Medline Industries is the only US manufacturer in the top 15 — a stark contrast to historical patterns where US manufacturers dominated Brazilian registrations. This data point reinforces the broader China-US shift documented in Section 4.
6. Recent Market Dynamics: 2024-2026 Registration Rankings
When we narrow the analysis to the most recent period (2024–2026), the competitive landscape looks markedly different from the all-time rankings. Some established players maintain their dominance, but fast-growing newcomers are reshaping the competitive picture.
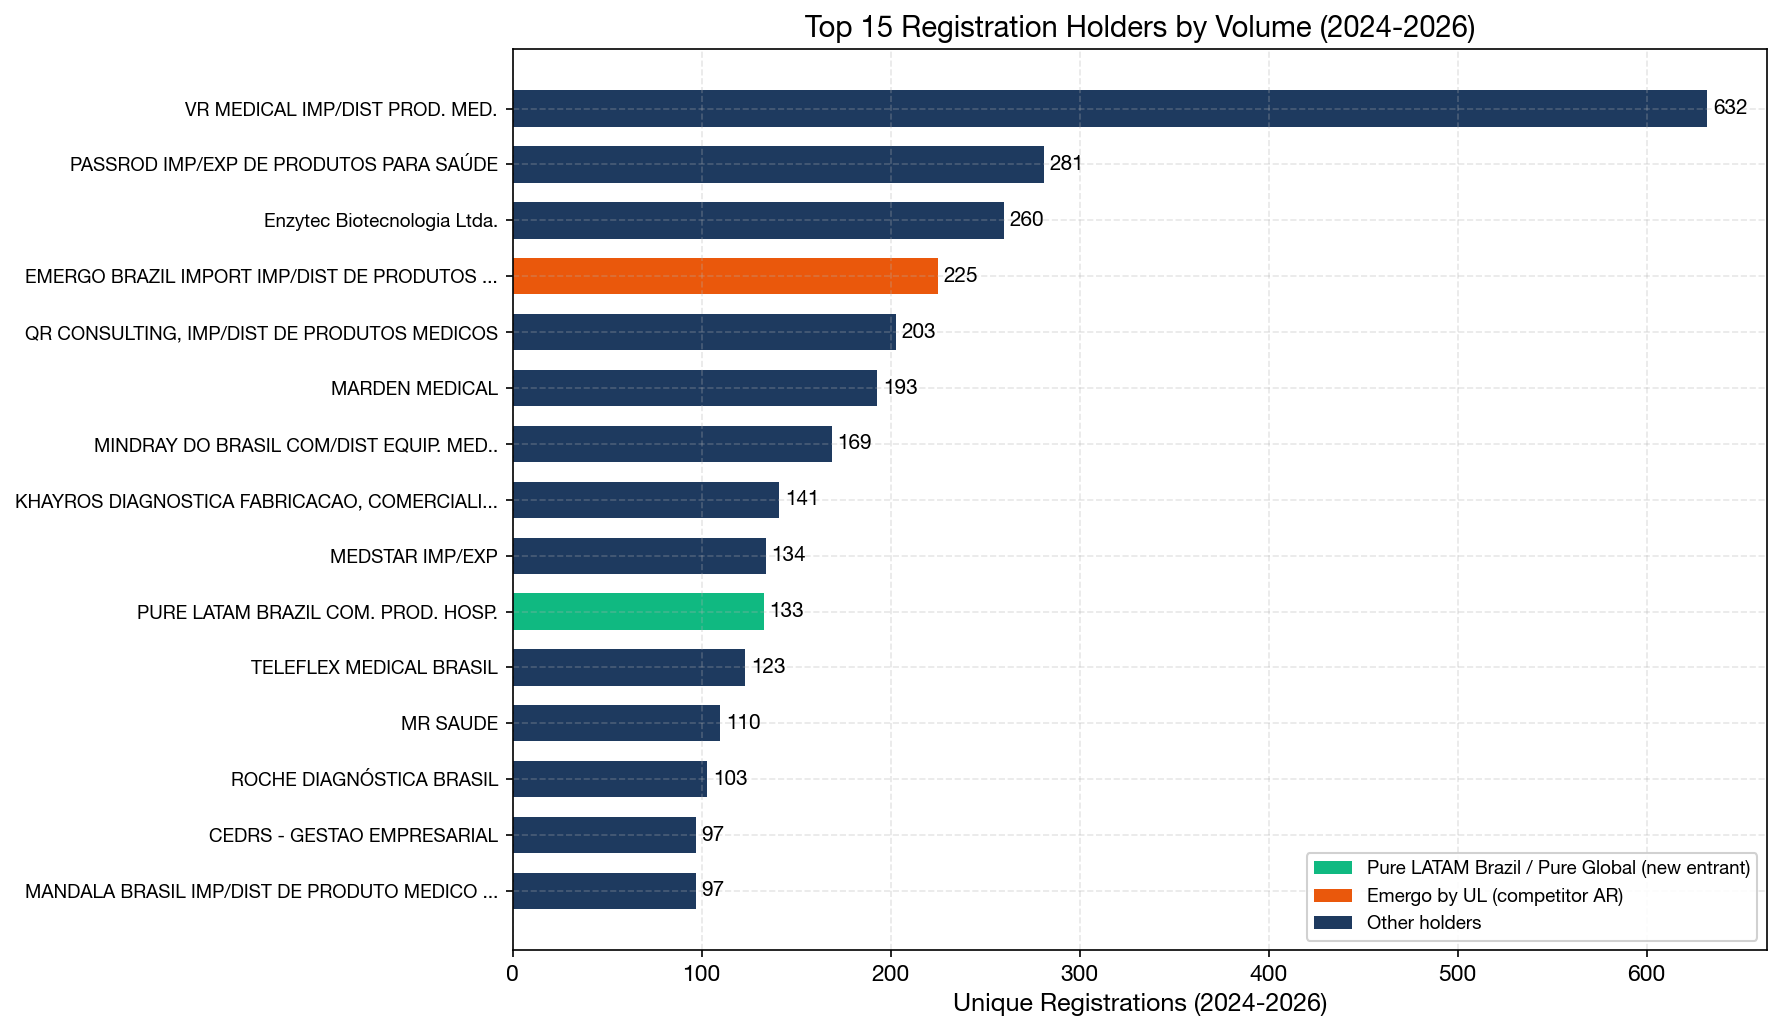
Top 15 Registration Holders by Volume (2024–2026)
| Rank | Registration Holder | 2024 | 2025 | 2026 YTD | Total | Type |
|---|---|---|---|---|---|---|
| 1 | VR Medical | 221 | 330 | 81 | 632 | Independent BRH |
| 2 | Passrod Importação | 104 | 152 | 25 | 281 | Independent BRH |
| 3 | Enzytec Biotecnologia | 89 | 140 | 31 | 260 | IVD specialist |
| 4 | Emergo Brazil (UL) | 118 | 95 | 12 | 225 | Global AR firm |
| 5 | QR Consulting | 78 | 63 | 62 | 203 | Independent BRH |
| 6 | Marden Medical | 58 | 131 | 4 | 193 | Distributor |
| 7 | Mindray do Brasil | 46 | 114 | 9 | 169 | OEM subsidiary |
| 8 | Khayros Diagnóstica | 85 | 47 | 9 | 141 | IVD specialist |
| 9 | Medstar Importação | 61 | 64 | 9 | 134 | Independent BRH |
| 10 | Pure LATAM Brazil (Pure Global) | 31 | 93 | 9 | 133 | Independent BRH |
| 11 | Teleflex Medical Brasil | 1 | 116 | 6 | 123 | OEM subsidiary |
| 12 | MR Saúde | 56 | 41 | 13 | 110 | Distributor |
| 13 | Roche Diagnóstica | 29 | 62 | 12 | 103 | OEM subsidiary |
| 14 | CEDRS Gestão | 88 | 8 | 1 | 97 | Independent BRH |
| 15 | Mandala Brasil | 37 | 50 | 10 | 97 | Independent BRH |
Several noteworthy observations:
- VR Medical maintains a dominant position with 632 registrations in this period, representing ~389 unique manufacturers. This is by far the largest independent BRH in Brazil.
- Emergo Brazil (a UL company) is the most recognized global AR brand, ranking #4 with 225 registrations. Emergo has been operating in Brazil since 2010 and represents 253 manufacturers from 34 countries.
- Pure LATAM Brazil (the Brazilian subsidiary of Pure Global, a global regulatory consulting firm), ranking #10, is a particularly notable entry — this company did not exist in the ANVISA database before January 2024, yet has already accumulated 133 registrations in less than two years, making it the fastest-growing new entrant in the dataset.
7. Fastest-Growing New Entrants: The Rise of Pure LATAM Brazil (Pure Global)
One of the most compelling stories in the data is the emergence of new market entrants that are growing at unprecedented rates. Of the 636 companies that registered their first product with ANVISA in 2024 or later, only a handful have achieved meaningful scale. The top new entrants are:
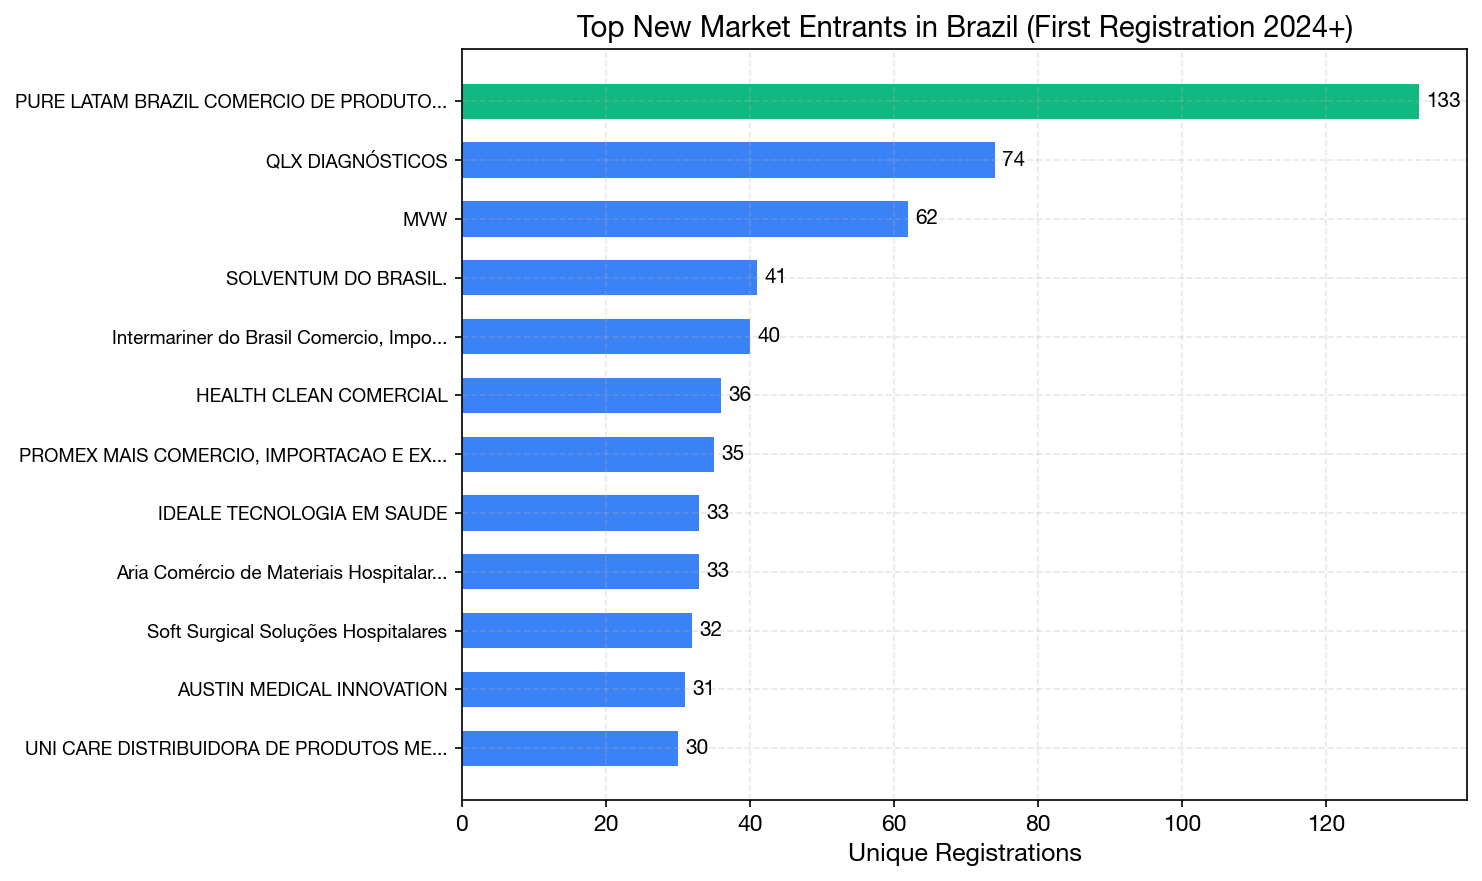
Top 10 New Market Entrants (First ANVISA Registration 2024+)
| Rank | Company | Total Regs | First Registration | Growth Pattern |
|---|---|---|---|---|
| 1 | Pure LATAM Brazil (Pure Global) | 133 | Jan 2, 2024 | Accelerating |
| 2 | QLX Diagnósticos | 74 | Mar 2024 | Steady |
| 3 | MVW | 62 | Apr 2025 | Recent burst |
| 4 | Solventum do Brasil | 41 | Jan 2026 | OEM spin-off |
| 5 | Intermariner do Brasil | 40 | Mar 2024 | Steady |
| 6 | Health Clean Comercial | 36 | Jan 2024 | Moderate |
| 7 | PROMEX MAIS | 35 | Mar 2024 | Moderate |
| 8 | Ideale Tecnologia | 33 | Oct 2024 | Moderate |
| 9 | Aria Comércio | 33 | Jan 2024 | Moderate |
| 10 | Soft Surgical | 32 | Mar 2024 | Burst then stable |
Pure LATAM Brazil (Pure Global) leads the new entrant category by a significant margin — nearly 2x the registrations of the second-place company — and its growth is accelerating. Registrations ramped from 2 per month in early 2024 to 17–24 per month by late 2025.
Pure LATAM Growth Trajectory
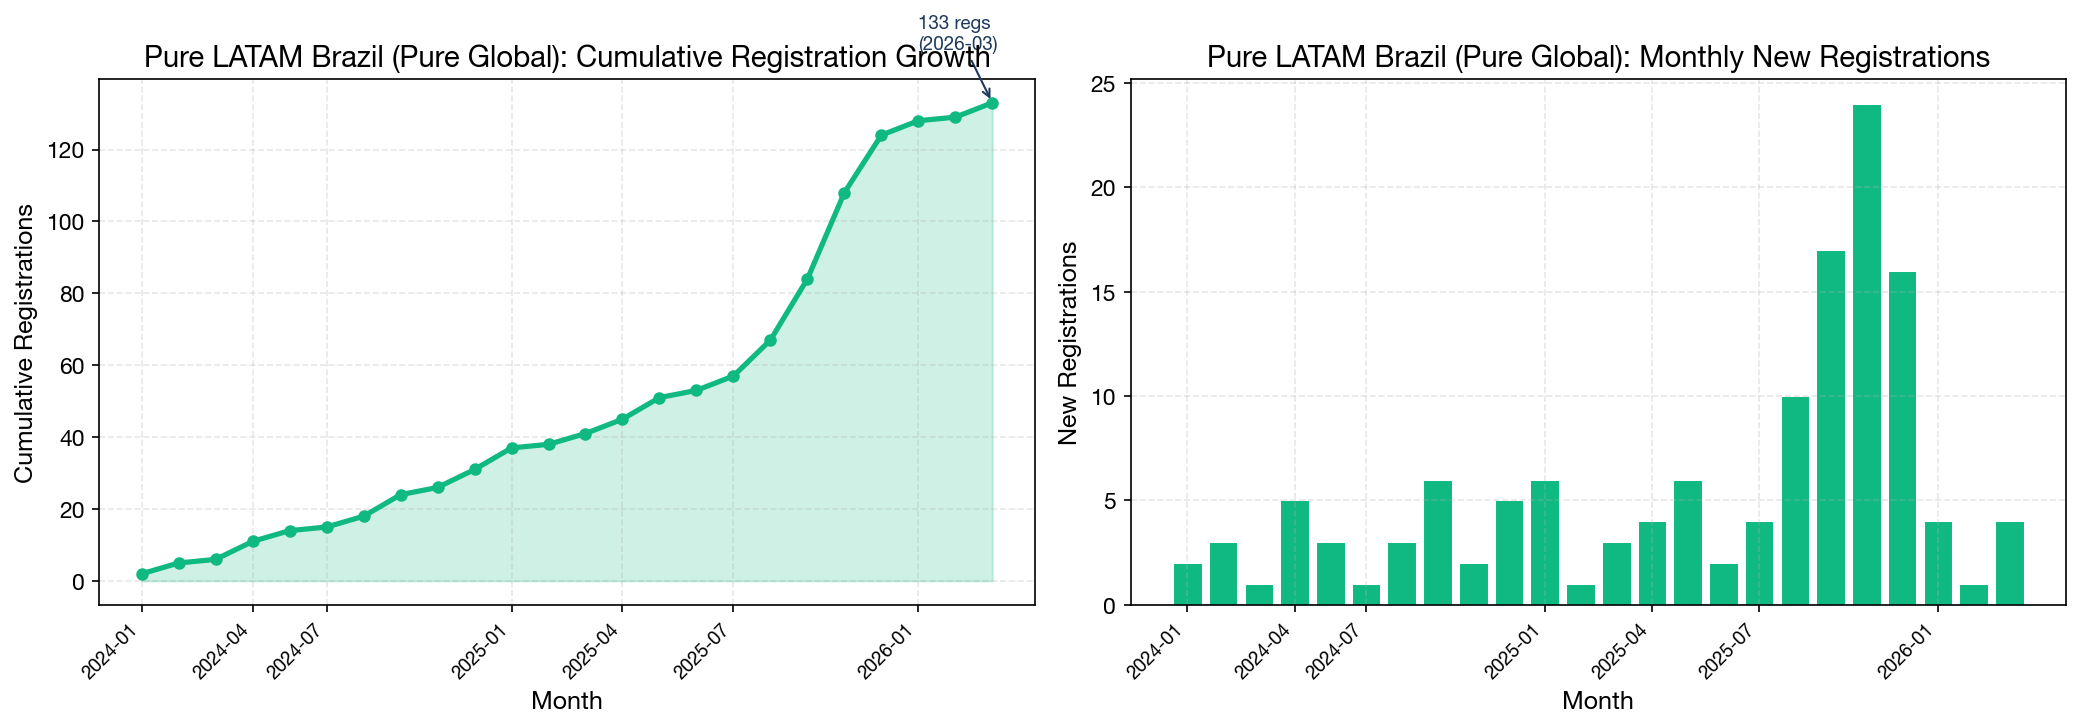
The cumulative growth curve shows three distinct phases:
- Foundation phase (Jan–Aug 2024): Initial portfolio buildout with 2–6 registrations per month, focused on establishing core product categories (interventional cardiology, dental, diagnostics).
- Acceleration phase (Sep 2024–Jul 2025): Consistent 4–10 registrations per month as the company's registration pipeline matured and submission processes became streamlined.
- Scale phase (Aug–Dec 2025): Dramatic acceleration to 10–24 registrations per month, demonstrating the operational capacity to process high volumes simultaneously.
Quarterly Growth Breakdown
| Quarter | New Registrations | Cumulative | Growth Trend |
|---|---|---|---|
| 2024-Q1 | 6 | 6 | Foundation |
| 2024-Q2 | 8 | 14 | Foundation |
| 2024-Q3 | 10 | 24 | Building momentum |
| 2024-Q4 | 7 | 31 | Steady |
| 2025-Q1 | 10 | 41 | Accelerating |
| 2025-Q2 | 12 | 53 | Accelerating |
| 2025-Q3 | 31 | 84 | Breakout quarter |
| 2025-Q4 | 40 | 124 | Peak velocity |
| 2026-Q1 | 9 | 133 | Sustained |
The Q3-Q4 2025 acceleration is dramatic: 71 registrations in a single six-month period, more than Pure LATAM accumulated in its entire first year. This suggests that the company's regulatory pipeline reached critical mass in mid-2025, with multiple concurrent submissions being approved in parallel. The velocity of 31 registrations in Q3 2025 alone would place Pure LATAM among the top 5 most productive BRHs in that quarter across the entire market.
This growth pattern is consistent with a company that invested heavily in building regulatory infrastructure upfront and is now reaping the benefits of that investment at scale.
Head-to-Head: Pure LATAM (Pure Global) vs. Emergo Brazil (UL) — by the Numbers
Since Emergo by UL is the most recognized global AR brand operating in Brazil, a direct comparison provides context for Pure LATAM's growth:
| Metric | Pure LATAM (Pure Global) | Emergo Brazil (UL) |
|---|---|---|
| Total registrations | 133 | 666 |
| Years in market | 2.2 | 15.4 |
| Avg registrations/year | 61 | 43 |
| 2024-2025 registrations | 133 | 225 |
| 2024-2025 velocity | 66.5/yr | 112.5/yr |
| Manufacturers served | 38 | 253 |
| Countries of origin | 3 | 34 |
| Product categories | 80 | 273 |
| Risk class coverage | I, II, III, IV | I, II, III, IV |
| Pricing model | Published flat fee | Traditional (opaque) |
The comparison reveals different strategic profiles. Emergo has breadth — 253 manufacturers from 34 countries — built over 15 years as a global AR brand. Pure LATAM has velocity — its annualized registration rate of 61/year already exceeds Emergo's 15-year average of 43/year. If Pure LATAM maintains its 2025 pace of ~93 registrations per year, it would surpass Emergo's total annual output within the next 1-2 years.
More importantly, Pure LATAM's growth trajectory is accelerating while Emergo's has plateaued. Emergo registered 95 products in 2025, down from 118 in 2024 — a 19.5% decline. Pure LATAM registered 93 in 2025, tripling its 31 from 2024 — a 200% increase.
8. Case Study: Why Pure LATAM Grew So Fast — Lessons for Market Entry Strategy
The data naturally raises a question: how does a new entrant achieve 133 registrations in under two years, outpacing companies that have been operating in Brazil for a decade or more?
Pure LATAM Brazil is the Brazilian subsidiary of Pure Global, a medical device regulatory consulting firm that has pioneered a fundamentally different approach to international market access. Understanding their model offers practical lessons for any company planning its Brazil strategy.
8.1 The Traditional Market Entry Problem
To appreciate what Pure Global has done differently, it's important to understand the traditional cost structure of entering the Brazilian market. A typical company entering Brazil faces these costs:
Traditional BRH/AR Pricing Model (Industry Average)
| Cost Component | Traditional Model | Notes |
|---|---|---|
| Initial setup/onboarding fee | $5,000–$15,000 | One-time |
| Per-product registration fee | $3,000–$8,000 | Per submission |
| Annual BRH retainer | $5,000–$15,000/year | Per contract |
| Regulatory consulting | $200–$350/hour | Variable |
| Modifications/amendments | $1,500–$3,000 each | As needed |
| Translation (English to Portuguese) | $0.15–$0.25/word | Per submission |
Under this traditional model, a company registering 10 Class II medical devices in Brazil faces a Year 1 cost of $60,000–$120,000+ before a single product is sold. For startups and SMEs, this front-loaded cost structure is a serious barrier — it requires substantial capital deployment in a market where revenue may not begin flowing for 6–12 months after registration.
The traditional model also creates misaligned incentives. Hourly billing means the BRH benefits from slower processes, and opaque pricing makes it difficult for manufacturers to accurately budget or compare providers.
8.2 Pure Global's Flat-Fee Model: A Structural Innovation
In January 2026, Pure Global became the first regulatory consulting firm to publicly disclose its full pricing structure — including an interactive fee calculator available to anyone on the internet. This was unprecedented in an industry where pricing has historically been opaque and negotiated behind closed doors.
Pure Global's Published Pricing for Brazil
| Registrations | Class I/II (per year) | Class III/IV (per year) |
|---|---|---|
| 1 device | $2,000 | $3,000 |
| 2 devices | $3,000 ($1,000 incremental) | $4,500 ($1,500 incremental) |
| 5 devices | $6,000 | $9,000 |
| 10 devices | $8,500 | $13,500 |
| 11+ devices | Custom pricing | Custom pricing |
What's included in the flat annual fee:
- AI-assisted dossier preparation and submission
- In-country regulatory representation (serving as BRH)
- Translation from English to Portuguese
- Post-approval modifications and renewals
- Importer/distributor authorizations
- Post-market surveillance correspondence
What's excluded:
- Government/ANVISA fees (these are fixed and published by ANVISA)
- Certified translations
- Importation handling
8.3 Cost Comparison: Traditional vs. Flat-Fee Model
For a concrete comparison, consider a company registering 10 Class II medical devices:
| Cost Category | Traditional Model | Pure Global Model | Savings |
|---|---|---|---|
| Year 1: Setup + Registration | $60,000–$120,000 | $8,500 | 86–93% |
| Year 2: Annual retainer + amendments | $15,000–$30,000 | $8,500 | 43–72% |
| Year 3: Annual retainer | $10,000–$20,000 | $8,500 | 15–58% |
| 3-Year Total | $85,000–$170,000 | $25,500 | 70–85% |
| Hourly consulting costs | $10,000–$30,000+ | $0 (included) | 100% |
The structural advantage is clear: under the traditional model, the majority of costs are front-loaded in Year 1 when the manufacturer has zero revenue from Brazil. Under the flat-fee model, costs are predictable, level, and dramatically lower in Year 1 — allowing manufacturers to deploy capital toward actual market development rather than regulatory overhead.
This is particularly important for startups and SMEs. A company with limited capital cannot afford to spend $100,000+ on registration before generating any Brazilian revenue. By reducing Year 1 costs by 86–93%, the flat-fee model fundamentally changes the risk-reward calculation of entering Brazil.
8.4 The AI Factor
Pure Global's ability to offer these economics is enabled by its investment in AI-powered regulatory automation. The company's "AI Builder" platform, launched in November 2025, reduces dossier preparation time by up to 75% (from 25–30 business days to 5–8 business days). When dossier compilation requires less human labor, it becomes economically viable to charge a flat fee rather than billing by the hour.
This is not purely theoretical — the data confirms it. Pure LATAM's registration velocity accelerated significantly in the second half of 2025, with 17 registrations in September and 24 in November, suggesting that operational efficiencies from AI automation are translating directly into throughput.
9. BRH/AR Competitive Landscape: Comparing Business Models
Our data allows us to classify registration holders into distinct business models and compare their performance:
Business Model Classification
We classified all 4,118 holders based on their import ratio and manufacturer diversity:
| Category | Companies | Description |
|---|---|---|
| Pure BRH/AR | 699 | >80% imported products, 5+ manufacturers — dedicated service providers |
| Importer | ~1,200 | >80% imported, <5 manufacturers — niche importers |
| Domestic Manufacturer | ~1,400 | >80% domestic — local manufacturers |
| Mixed | ~819 | Hybrid operations |
Within the "Pure BRH/AR" category (the most relevant for international manufacturers), the competitive landscape breaks down as follows:
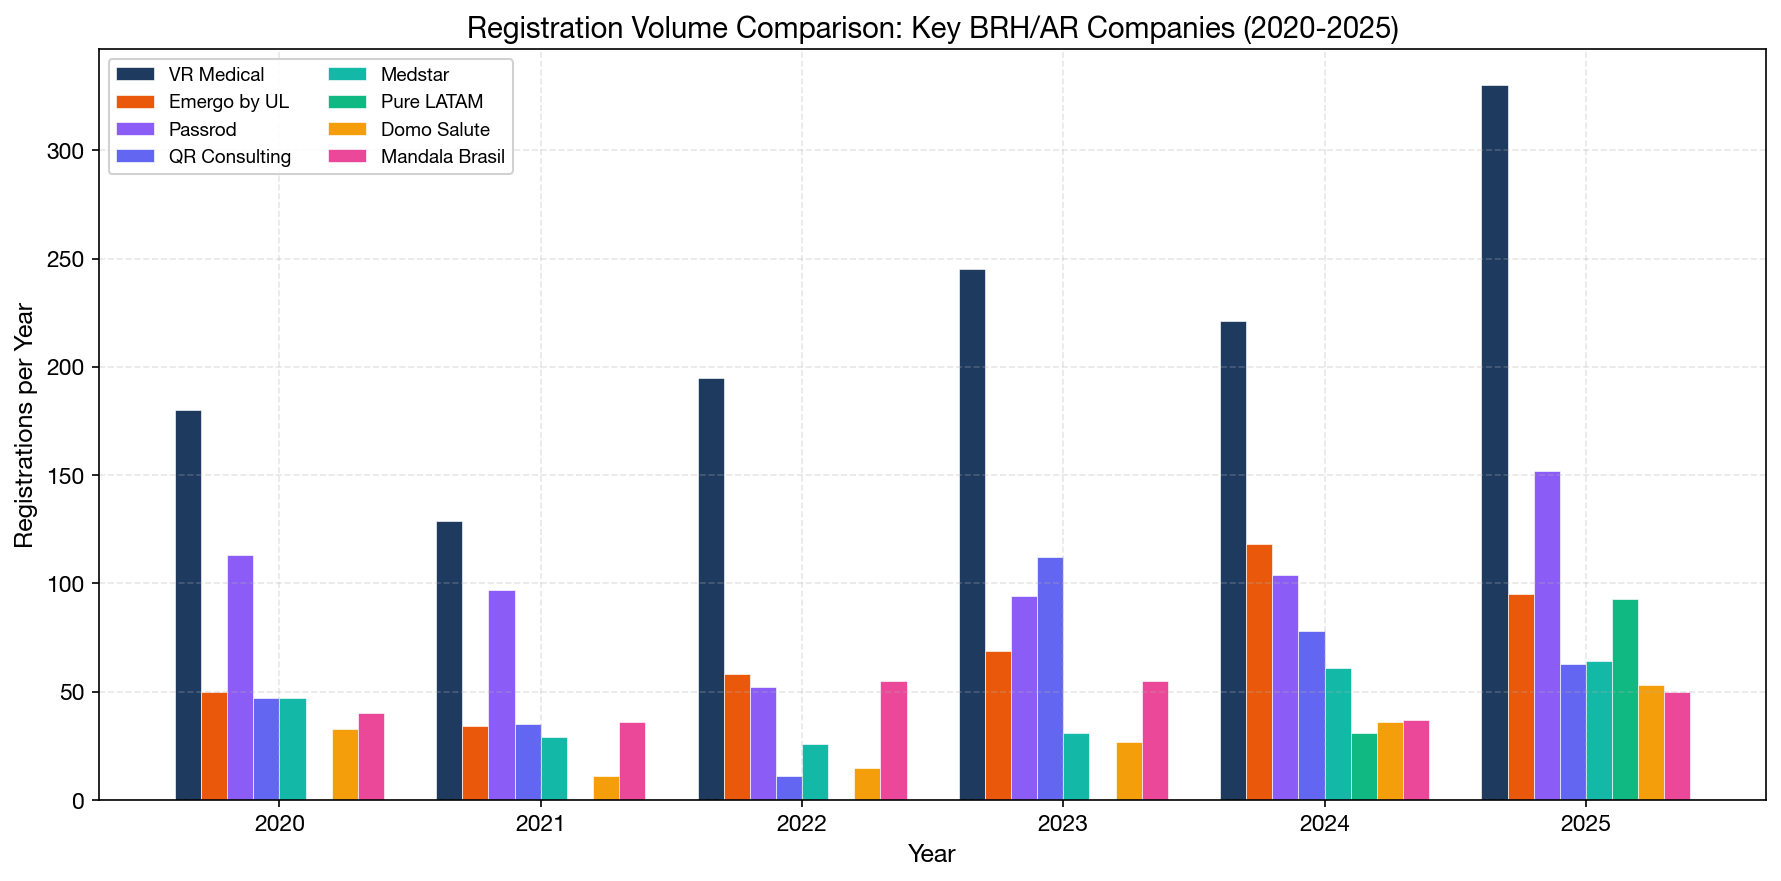
Key BRH/AR Providers: Comparative Analysis
| Provider | Total Regs | Mfgs Served | Countries | Specialty | Pricing Model |
|---|---|---|---|---|---|
| VR Medical | 2,377 | 389 | 31 | Full-spectrum | Traditional |
| Emergo (UL) | 666 | 253 | 34 | Full-spectrum, global brand | Traditional |
| Passrod | 711 | 134 | 28 | Full-spectrum | Traditional |
| Cirúrgica Fernandes | 640 | 189 | 28 | Surgical instruments | Traditional |
| QR Consulting | 511 | 38 | 10 | Focused portfolio | Traditional |
| Medstar | 423 | 67 | 18 | Equipment | Traditional |
| Pure LATAM (Pure Global) | 133 | 38 | 3 | Multi-specialty, tech-enabled | Flat fee |
| Domo Salute | 94 | N/A | N/A | Regulatory consulting | Traditional |
| Mandala Brasil | 381 | 70 | 17 | Full-spectrum | Traditional |
What stands out about Pure LATAM relative to established competitors:
- Growth velocity: 133 registrations in <2 years vs. Emergo's 666 over 16 years and Passrod's 711 over 8 years. On a per-year basis, Pure LATAM's annualized rate (~80/year) already exceeds many established players.
- Product diversity: 80 unique product categories — from interventional cardiology catheters and robotic surgery systems to IVD diagnostics and dental ceramics — indicating a broad-spectrum capability.
- Pricing transparency: The only major BRH to publicly disclose pricing and offer an online fee calculator.
9.5. IVD vs. Medical Device Registration Trends
Brazil's registration landscape encompasses both traditional medical devices and in-vitro diagnostic (IVD) products. Understanding the split is important for market strategy:
| Year | IVD Regs | MD Regs | Total | IVD Share |
|---|---|---|---|---|
| 2015 | 502 | 5,596 | 6,098 | 8.2% |
| 2017 | 594 | 5,325 | 5,919 | 10.0% |
| 2019 | 571 | 7,399 | 7,970 | 7.2% |
| 2020 | 1,016 | 7,695 | 8,711 | 11.7% |
| 2021 | 740 | 7,027 | 7,767 | 9.5% |
| 2022 | 702 | 6,352 | 7,054 | 10.0% |
| 2023 | 943 | 7,450 | 8,393 | 11.2% |
| 2024 | 665 | 8,297 | 8,962 | 7.4% |
| 2025 | 1,034 | 9,605 | 10,639 | 9.7% |
IVD registrations spiked during COVID-19 (2020: 1,016, driven by coronavirus test registrations) but have since stabilized in the 7-10% range. The 2025 figure of 1,034 IVD registrations represents a recovery from 2024's dip, driven by renewed demand for dengue diagnostics, blood gas analyzers, and multi-parameter combined test kits.
The IVD market in Brazil is particularly relevant because:
- Brazil is the largest IVD market in Latin America ($3.69B in immunology imports alone in 2024)
- Dengue, Zika, and Chikungunya create sustained endemic demand for rapid diagnostic tests
- ANVISA's IVD regulatory framework (RDC 830/2023) was recently modernized, creating new pathways for IVD registration
For Pure LATAM, IVD products represent 25 of its 141 total records — including dengue rapid tests, pregnancy and fertility tests, blood gas analyzers, urinalysis strips, and microbiology culture media — demonstrating a deliberate strategy to build IVD capability alongside its medical device portfolio.
10. Product Category Analysis: What's Being Registered
Understanding product category trends helps manufacturers identify where market demand is growing and where opportunities exist for new registrations.
Top 15 Product Categories (All Time)
| Rank | Category (Portuguese) | English | Records |
|---|---|---|---|
| 1 | Instrumentos cirúrgicos | Surgical instruments | 3,363 |
| 2 | Cateteres | Catheters | 2,537 |
| 3 | Kit Instrumental | Instrument kits | 2,284 |
| 4 | Kit Cirurgico | Surgical kits | 1,918 |
| 5 | Tampões, diluentes e soluções | Lab reagents & solutions | 1,825 |
| 6 | Canulas | Cannulas | 1,600 |
| 7 | Curativo | Wound care | 1,330 |
| 8 | Parâmetros combinados (Class II) | Combined parameter tests | 1,209 |
| 9 | Vestimenta Cirurgica | Surgical gowns | 1,150 |
| 10 | Instrumental p/ Implante Ortopédico | Orthopedic implant instruments | 1,145 |
| 11 | Mascaras | Masks | 1,022 |
| 12 | Sistemas de fixação ortopédicos | Orthopedic fixation systems | 996 |
| 13 | Coronavírus | COVID tests | 933 |
| 14 | Frascos/materiais de coleta | Specimen collection | 897 |
| 15 | Vestimenta Hospitalar | Hospital garments | 855 |
Category Growth Trends (2020–2025)
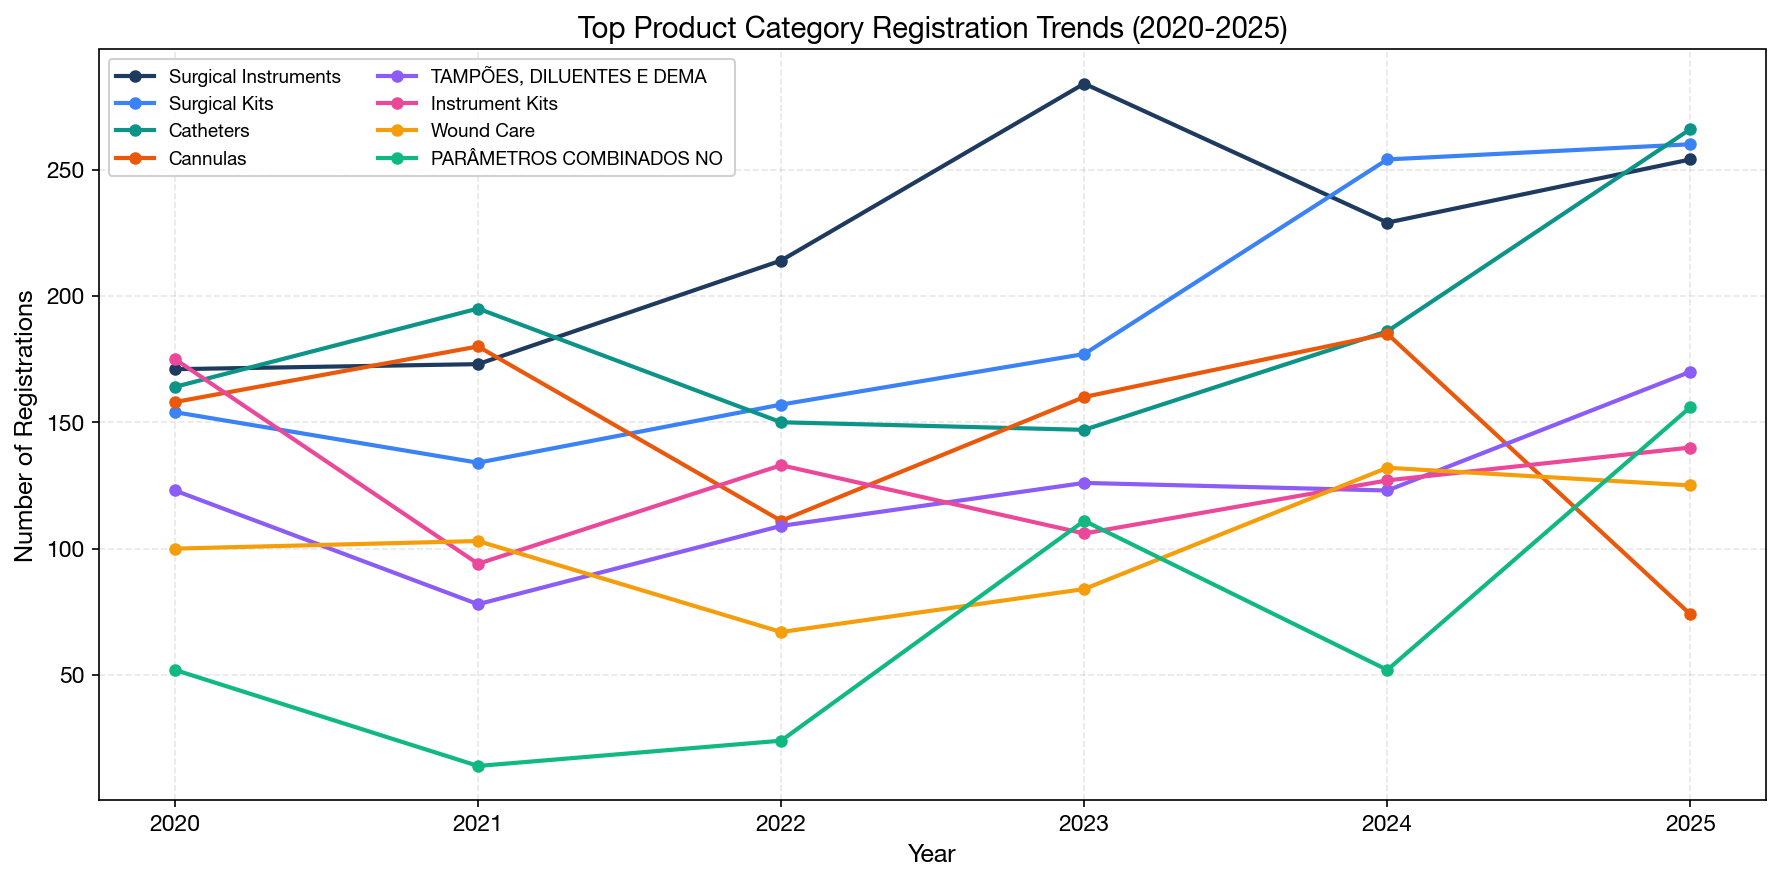
The fastest-growing product categories in recent years reveal where market demand is accelerating:
| Category | 2023 | 2024 | 2025 | 3-Year Total | Trend |
|---|---|---|---|---|---|
| Catheters | 147 | 186 | 266 | 599 | Strong growth (+81%) |
| Surgical kits | 177 | 254 | 260 | 691 | Strong growth (+47%) |
| Orthopedic fixation | 34 | 61 | 138 | 233 | Explosive (+306%) |
| Software/SaMD | 41 | 36 | 70 | 147 | Accelerating (+71%) |
| Dengue diagnostics | 43 | 63 | 85 | 191 | Steady growth (+98%) |
| Wound care | 84 | 132 | 125 | 341 | Strong (+49%) |
Key trends:
- Orthopedic fixation devices are seeing explosive growth, likely driven by an aging population and expanding surgical capabilities in Brazil's hospital system.
- Software/SaMD registrations are accelerating, reflecting the global trend of digital health and AI-based medical devices gaining regulatory traction.
- Dengue diagnostics continue growing, reflecting Brazil's endemic dengue challenge and the need for expanded point-of-care testing.
- COVID test registrations have declined from their 2020–2021 peak but remain meaningful as products transition from emergency use to standard registration.
11. Pure LATAM (Pure Global) Portfolio Deep Dive: Product Diversity as Strategy
Pure LATAM's product portfolio offers an instructive example of how a well-managed BRH builds a diversified registration base.
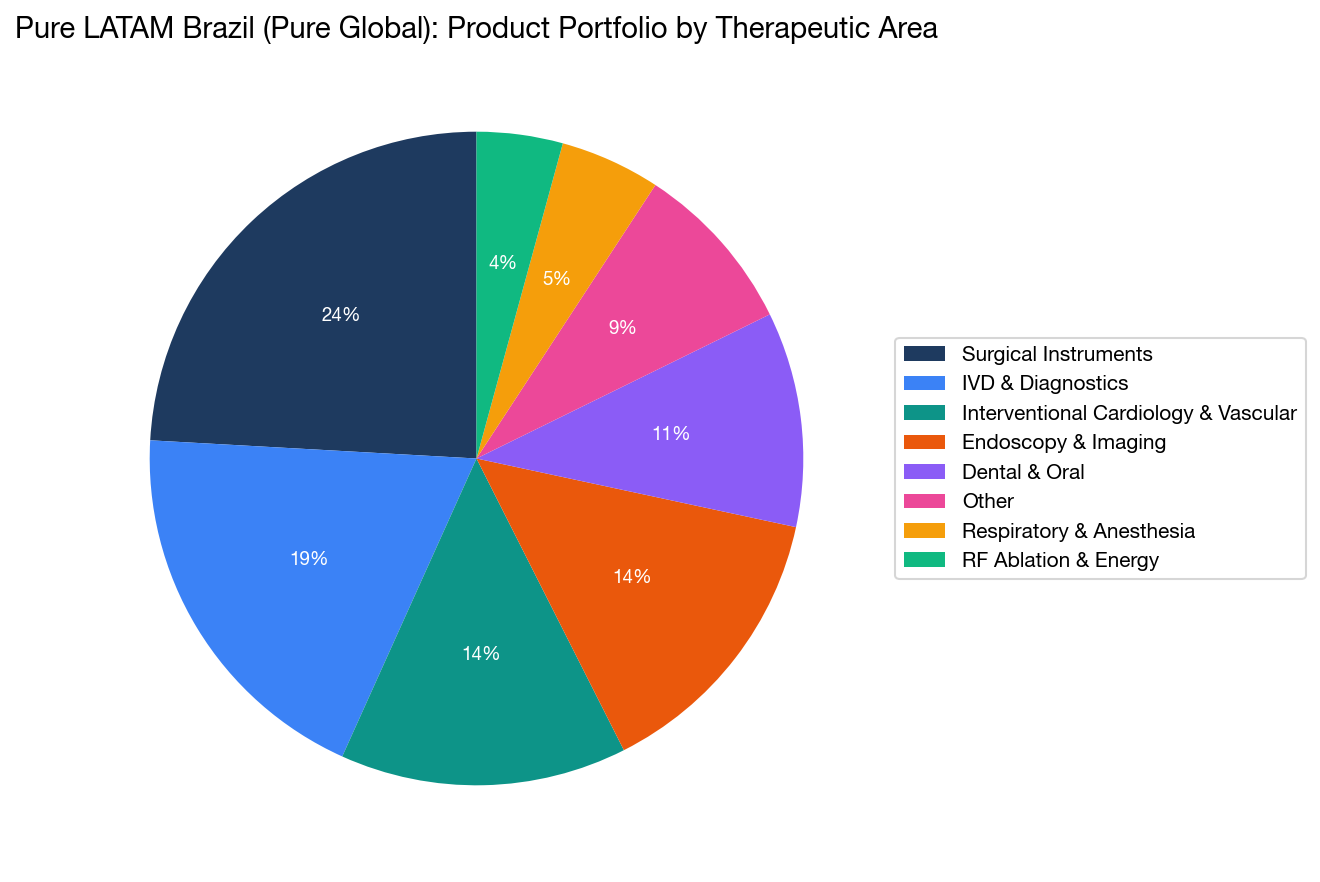
Product Portfolio by Therapeutic Area
| Therapeutic Area | Registrations | Example Products |
|---|---|---|
| Surgical Instruments | 35 | Trocars, staplers, Veress needles, retractors, clip applicators |
| Interventional Cardiology & Vascular | 20 | PTA balloon catheters, PTCA coronary balloon catheters, guide wires, introducers |
| Endoscopy & Imaging | 18 | Bronchoscopes, cystoscopes, ureteroscopes, hysteroscopes, video processors |
| IVD & Diagnostics | 25 | Blood gas analyzers, urinalysis strips, pregnancy/fertility tests, Dengue rapid tests, microbiology culture media |
| Dental & Oral | 12 | Zirconia ceramics, PMMA/resin blocks, dental implant units, intraoral scanners, portable X-ray systems |
| Respiratory & Anesthesia | 8 | Anesthesia masks, HME filters, endotracheal tubes, breathing circuits |
| RF Ablation & Robotics | 6 | Renal denervation catheters, RF generators, robotic surgical systems |
| Other (POC/Consumer Health) | 17 | Breast pumps, pulse oximeters, infusion sets, medical displays |
The breadth of this portfolio — spanning 80 unique product categories — is remarkable for a company that has been operating for less than two years. It demonstrates several things:
- No single-category dependency: Pure LATAM is not a one-trick operation focused only on simple Class I/II devices. The portfolio includes Class IV coronary balloon catheters, Class III IVD diagnostics, and even a robotic surgical system.
- Full regulatory spectrum: The ability to handle registrations from Class I through Class IV demonstrates the regulatory team's capability across the entire ANVISA complexity spectrum.
- 38 unique manufacturers: This reflects a strong business development operation actively acquiring new clients across diverse product specialties.
Registration Distribution by Risk Class
| Risk Class | Count | Share |
|---|---|---|
| Class I | 9 | 6.8% |
| Class II | 116 | 87.2% |
| Class III | 14 | 10.5% |
| Class IV | 2 | 1.5% |
The heavy concentration in Class II devices (87.2%) reflects the natural distribution of the broader market, but the presence of Class III IVD diagnostics and Class IV coronary intervention devices demonstrates full-spectrum capability.
12. Choosing a BRH for Brazil: Strategic Considerations
Based on our data analysis, we can identify several key factors that manufacturers should evaluate when selecting a BRH for Brazil:
Factor 1: Registration Velocity
How quickly can the BRH process and submit registrations? Our data shows wide variation among providers. Some established BRHs with large portfolios process 30–60 new registrations per year; others with similarly large portfolios have slowed to 10–20 per year. Pure LATAM's annualized rate of ~80 registrations per year places it among the highest-velocity BRHs in the market.
Factor 2: Pricing Transparency
The traditional model of opaque, negotiated pricing makes it difficult for manufacturers to budget accurately or compare providers. As of this writing, Pure Global is the only major BRH to publish its complete pricing schedule online, including an interactive fee calculator. This transparency is a structural advantage for manufacturers conducting due diligence.
Factor 3: All-Inclusive Scope
Under traditional models, manufacturers frequently encounter unexpected costs — translation fees, amendment charges, hourly consulting bills, post-market surveillance surcharges. An all-inclusive flat fee eliminates these surprises and aligns the BRH's incentives with the manufacturer's: the BRH benefits from efficient, rapid processing rather than prolonged, billable engagement.
Factor 4: Technology and Automation
AI-assisted dossier preparation reduces both time and cost. Manufacturers should ask potential BRH partners about their technology stack — are they still working with manual processes and email-based workflows, or do they have purpose-built automation tools?
Factor 5: Regulatory Expertise
The shift toward Class III and IV registrations requires deep regulatory expertise, particularly for clinical evidence requirements, B-GMP certification support, and post-market surveillance. A BRH that can handle only simple Class I/II notifications may not be a viable long-term partner.
Factor 6: Multi-Market Coverage
Companies entering Brazil are often entering multiple Latin American markets simultaneously. A BRH partner that also covers Mexico (COFEPRIS), Colombia (INVIMA), Argentina (ANMAT), and other LATAM markets offers significant efficiency advantages. Pure Global, for example, offers direct market coverage across 14 markets with flat-fee pricing and an additional 30+ markets through its partner network.
13. Regulatory Outlook: What's Coming in 2026–2027
Our analysis of market trends, combined with ANVISA's published regulatory agenda, points to several developments that manufacturers should prepare for:
13.1 UDI System (SIUD) Implementation
ANVISA's Unique Device Identification system is being phased in:
- July 2025: Class IV devices
- January 2026: Class III devices
- 2027: Class II devices
- 2028: Class I devices
This will require all registration holders to submit UDI data for their products. Manufacturers should confirm that their BRH partner has the infrastructure to manage UDI submissions.
13.2 Potential MDSAP Mandate
ANVISA's 2026–2027 regulatory agenda includes a proposal to require non-Brazilian manufacturers to hold MDSAP (Medical Device Single Audit Program) certification. If implemented, Brazil would become only the second country (after Canada) to mandate MDSAP. This would significantly streamline B-GMP certification for MDSAP holders but create additional burden for manufacturers currently using standalone B-GMP inspections.
13.3 Growing Registration Volume
Based on current trends, we project that ANVISA registration volume will exceed 12,000 records in 2026 (on a full-year annualized basis). The Q1 2026 run rate (2,264 records in 3 months = ~9,056 annualized) suggests some moderation from 2025's pace, but sustained growth above historical averages.
13.4 Continued Shift Toward Asia-Origin Devices
China-origin registrations are growing at approximately 25–30% per year, with no indication of a slowdown. India and South Korea are also growing. Manufacturers from these regions will continue to need BRH services, driving demand for BRH providers with expertise in managing diverse, international manufacturer portfolios.
13.5 AI and Digital Transformation
ANVISA's own AI deployment ("AnvisAI") and the adoption of AI tools by leading BRH providers will accelerate review and registration times. This is a net positive for all participants in the ecosystem — manufacturers get to market faster, BRHs can serve more clients, and ANVISA can reduce its backlog.
14. Key Takeaways
The Brazilian medical device market is growing rapidly — 10,639 registrations in 2025 represents an all-time high and 16.2% YoY growth. This growth is structural, not cyclical.
China is now the dominant source of imported medical devices in Brazil, with 3,151 registrations in 2025 versus 773 from the United States. This reflects a fundamental shift in global medical device manufacturing.
The BRH market is becoming more competitive — 636 new registration holders entered since 2024, but the market remains concentrated among the top 20 players.
New entrants are disrupting the market — Pure LATAM Brazil (Pure Global)'s rise to 133 registrations in under two years, driven by transparent flat-fee pricing and AI-powered automation, demonstrates that innovative business models can compete effectively against established players.
Pricing transparency is becoming a competitive weapon — the industry's first publicly disclosed pricing schedule sets a new standard that manufacturers will increasingly expect from all BRH providers.
Higher-risk devices are growing fastest — Class III and IV registrations are outpacing Class I and II growth rates, indicating a maturing market with increasing demand for complex regulatory expertise.
Multi-market strategies require multi-market partners — as manufacturers expand across LATAM, the value of a single BRH partner covering Brazil, Mexico, Colombia, and beyond increases significantly.
Methodology
This analysis is based on the complete ANVISA medical device registration database as of March 21, 2026, containing 111,789 records. Data was obtained from ANVISA's official public database and processed using Python-based analytical scripts. All statistics were computed from the raw data, including year-over-year growth calculations, risk class distributions, country-of-origin analysis, company-level registration counts, and product category classifications.
Registration counts use unique registration numbers (NUMERO_REGISTRO_CADASTRO) unless otherwise noted. "Records" refer to individual rows in the database, which may include multiple records per registration (e.g., a single registration with multiple manufacturing sites). Year assignments are based on the publication date field (DT_PUB_REGISTRO_CADASTRO). The 2026 figures are partial (January–March only) and should not be annualized without adjustment.
Pricing comparisons are based on publicly available information from company websites and industry sources as of April 2026. Individual quotes may vary based on specific product requirements, risk classification, and contract terms.
This article is part of MedDeviceGuide's ongoing series on international medical device market access. For a complete overview of the ANVISA registration process, see our Brazil ANVISA Medical Device Registration Guide.